We will be using the National Weather Service Guidelines on Cloud Classification.
More information on daily observations can be found at the "Daily Cloud Entries" Page .
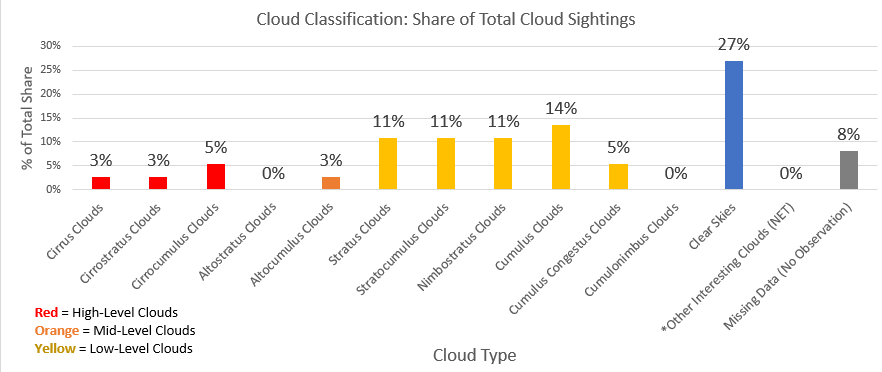
Current Total Number of Observations as of Oct 10th, 2022: 30 Observations
*Other Interesting Clouds include all those less common cloud types specified by Nation Weather Service .
**Please note that cloud observations are at discrete times and places, and are not representative of all cloud formations over New York.
***Please note: Any observations not captured in New York State will not be classified, and will be categorized with the "Missing Data (No Observation)" group.
| Cloud Level | Type of Cloud Classification | Frequency of Observations |
|---|---|---|
| High Level Clouds | Cirrus Clouds | 1 |
| High Level Clouds | Cirrostratus Clouds | 1 |
| High Level Clouds | Cirrocumulus Clouds | 2 |
| Mid-Level Clouds | Altostratus Clouds | 0 |
| Mid-Level Clouds | Altocumulus Clouds | 1 |
| Low-level Clouds | Stratus Clouds | 4 |
| Low-level Clouds | Stratocumulus Clouds | 4 |
| Low-level Clouds | Nimbostratus Clouds | 4 |
| Low-level Clouds | Cumulus Clouds | 5 |
| Low-level Clouds | Cumulus Congestus Clouds | 2 |
| Low-level Clouds | Cumulonimbus Clouds | 0 |
| Low-level Clouds | Clear Skies | 10 |
| Other Interesting Clouds | (NET) | 0 |
| Missing Data (No Observations) | n/a | 3 |
| Total # Observations = 37 | ||
Email us your opinions on the classifications of the day for discussion, or send your own cloud pictures for a spotlight on the website!